Buy/Sell Signals w/BB, but w/ repeat alerts enabledThis is "Advanced Buy/Sell Signals w/ BB by mattzab" but allows for signals to repeat consecutively. Typically used on the 1 day resolution.
You can program the alerts to autotrade for you on an exchange like Binance via a chrome extensions or other programs if you want.
"Buy sell" için komut dosyalarını ara


TonyUX EMA Scalper - Buy / SellThis is a simple scalping strategy that works for all time frames... I have only tested it on FOREX
It works by checking if the price is currently in an uptrend and if it crosses the 20 EMA.
If it crosses the 20 EMA and its in and uptrend it will post a BUY SIGNAL.
If it crosses the 20 EMA and its in and down it will post a SELL SIGNAL.
The red line is the highest close of the previous 8 bars --- This is resistance
The green line is the lowest close of the previous 8 bars -- This is support

Enhanced Buy/Sell Pressure, Volume, and Trend Bar analysisEnhanced Buy/Sell Pressure, Volume, and Trend Bar Analysis Indicator
Overview
This indicator is designed to help traders identify buy and sell pressure, volume changes, and overall trend direction in the market. It combines multiple concepts like price action, volume, and trend analysis, candlestick anaysis to provide a comprehensive view of market dynamics. The visual elements are intuitive, making it suitable for traders at different levels. This indicator works together with Enhanced Pressure MTF Screener which is a screener based of this indicator to make it easier to see Bullish/Bearish pressures and trend across multiple timeframes.
Image below: is the Enhanced Buy/Sell Pressure, Volume, and Trend Bar Analysis with the Enhanced Pressure MTF Screener indicator both active together.
Key Features
1.Buy/Sell Pressure Identification
Buy Pressure: Calculated based on price movement where the close price is higher than the opening price.
Sell Pressure: Calculated when the closing price is equal to or lower than the opening price.These pressures help you understand whether buyers or sellers are more dominant for each bar.
2.Volume Analysis
Normalized Volume: Volume data is normalized, making it easier to compare volume levels over different periods.
Volume Histogram: The volume is also presented as a histogram for easy visualization, showing whether the current volume is higher or lower compared to the average.
3.Simplified Coloring Option
You can choose to simplify the coloring of bars to reflect the dominant pressure: green for bullish pressure and red for bearish pressure. This makes it visually easier to identify who is in control. When simplified coloring is disabled, the bars' colors will represent the combined effect of buy and sell pressure.
4.Heikin-Ashi Candles for Pressure Calculation
The indicator includes an option to use Heikin-Ashi candles instead of traditional candles to calculate buy and sell pressure. Heikin-Ashi candles are known for smoothing out price action and providing a clearer trend representation.
5.Trend Background Coloring
This feature uses exponential moving averages (EMAs) to determine the trend:
Short-Term EMA vs. Long-Term EMA: When the short-term EMA is above the long-term EMA, the trend is considered bullish, and vice versa.
The background color changes based on the identified trend: green for an uptrend and red for a downtrend. This feature helps visualize the overall market direction at a glance.
6.Signals for Key Price Actions
The indicator plots various symbols to signal important price movements:
Bullish Close (▲): Indicates a strong upward movement where the close price crosses above the open.
Bearish Close (▼): Indicates a downward movement where the close price falls below the open.
Higher High (•): Highlights new highs compared to previous bars, useful for confirming an uptrend.
Lower Low (•): Highlights lower lows compared to previous bars, which can indicate a downtrend or bearish pressure.
Calculations Explained
1.Buy and Sell Pressure Calculation
The buy pressure is determined by the price range (high - low) if the closing price is above the opening price, indicating an increase in value.
The sell pressure is similarly calculated when the closing price is equal to or below the opening price.
The indicator uses the Average True Range (ATR) for normalization. Normalizing helps you compare pressure across different periods, regardless of market volatility.
2.Volume Normalization
Volume Normalization: To make volume comparable across different periods, the indicator normalizes it using the Simple Moving Average (SMA) of volume over a user-defined length.
Volume Histogram: The histogram provides a clear representation of volume changes compared to the average, making it easier to spot unusual activity that may indicate market shifts.
3.Combined Pressure Calculation
The indicator calculates a combined pressure value by subtracting sell pressure from buy pressure.
When combined pressure is positive, buying is dominant, and when negative, selling is dominant. This helps in visually understanding the ongoing momentum.
4.Trend Calculation
The indicator uses two EMAs to determine the trend:
Short-Term EMA (default 14-period) to capture recent price movements.
Long-Term EMA (default 50-period) to provide a broader trend perspective.
By comparing these EMAs on a higher timeframe, the indicator can identify whether the trend is up or down, making it easier for traders to align their trades with the larger market movement.
Inputs and Customization
The indicator provides several options for customization, allowing you to adjust it to your preferences:
SMA Length: Determines the lookback period for moving averages and volume normalization. A longer length provides more smoothing, whereas a shorter length makes the indicator more responsive.
Buy/Sell/Volume Colors: Customize the colors used to represent buying, selling, and volume to suit your preferences.
Heikin Ashi Option: Toggle between using Heikin Ashi or traditional OHLC (Open-High-Low-Close) candles for pressure calculations.
Trend Timeframe and EMA Periods: You can choose different timeframes and EMA periods for trend analysis to suit your trading strategy.
How to Use This Indicator
Identifying Market Momentum: Use the buy/sell pressure columns to see which side (buyers or sellers) is in control. Positive pressure combined with green color indicates strong buying, while red indicates selling.
Volume Confirmation: Check the volume area plot and histogram. High volume coupled with strong pressure is a sign of conviction, meaning the current move has backing from market participants.
Trend Identification: The trend background color helps identify the overall trend direction. Trade in the direction of the trend (e.g., take long positions during a green background).
Signal Indicators: The plotted symbols like "Bullish Close" and "Bearish Close" provide visual signals of key price actions, useful for timing entry or exit points.
Practical use Example
Scenario: The market is consolidating, and you see alternating green and red bars.
Action: Wait for a consistent sequence of green bars (buy pressure) along with a green background (uptrend) to consider going long, although you can go long without having a green background, the background adds confirmation layer.
Scenario: The market has several bearish closes (red ▼ symbols) accompanied by increasing volume.
Action: This could indicate strong selling pressure. If the background also turns red, it might be a good time to exit long positions or consider shorting.
Higher timeframe pressure and volume: Another way to use the indicator is to check buy/sell volume and pressure of the higher timeframe say weekly or daily or any timeframe you consider higher, once you’ve identified or feel confident in which direction the bar is going along with the full picture of trend, you can go to the lower timeframe and wait for it to sync with the higher timeframe to consider a long or a short. It is also easier to see when markets sync up by also applying the Enhanced Pressure MTF Screener which works in companion to this indicator.
Visual Cues and Interpretation
Combined Pressure Plot: The green and red column plot at the bottom of the chart represents the dominance between buying and selling. Tall green bars signify strong buying, while tall red bars indicate selling dominance.
Trend Background: Helps visualize the overall direction without manually drawing trend lines. When the background turns green, it generally indicates that the shorter-term moving average has crossed above the longer-term average—a sign of a bullish trend.
To Summarize shortly
The Enhanced Buy/Sell Pressure, Volume, and Trend Bar Analysis Indicator is an advanced but simple tool designed to help traders visually understand market dynamics. It combines different aspects of market analysis of candle pressure from buyers and sellers, volume confirmation, and trend identification into a single view, which can assist both new and experienced traders in making informed trading decisions.
This indicator:
Saves time by simplifying market analysis.
Provides clear visual cues for buy/sell pressure, volume, and trend.
Offers customizable settings to suit individual trading styles.
Always, I am happy to share my creations with you all for free. If you guys have cool ideas you would like to share, or suggestions for improvements the comment is below and I hope this overview gave an idea of how to use the indicator :D

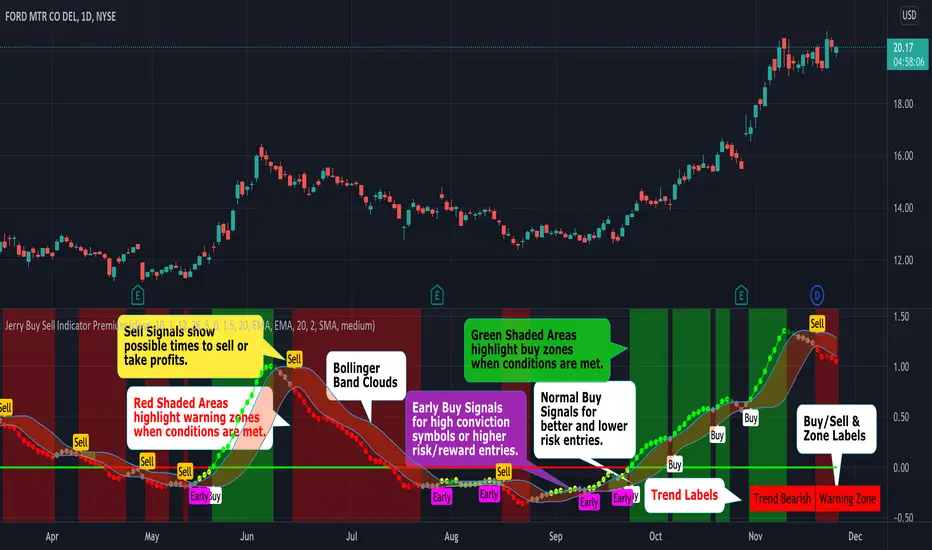
Jerry Buy Sell IndicatorThis indicator has unique conditions in the script that create the following:
1. Buy and Sell zones
2. Early Buy, Buy and Sell signals that are determined by conditions including relative position to the zero line.
3. Defines 6 different short term trends
4. Trend Labels to show the current short term trend (located in the lower right corner).
5. Buy, Sell, Buy Zone & Warning Zone Labels
6. 14 user controlled inputs allow the user to customize the settings.
7. Unique functionality that allows you to create trade alerts based on conditions being met with criteria scans built into the indicator.
# 7 is a cool unique feature of our indicator. For example you can easily create a TRADE ALERT for a symbol based on a Buy Signal being met in any time frame. This is possible because we have built into the script the ability to select multiple conditions including BUY ALERT, EARLY BUY ALERT AND SELL ALERT. You can also use the alerts to scan your stocks individually for buy zones and warning zones or for crossing above or below the clouds. TradingView alerts can notify you via pop-up, email, sound notification, email to SMS & sound notifications.
Buy Sell Indicator Features
----- Trends
- Red Dots (Red Cloud) = Warning zone. Generally do not buy or consider selling.
- Dark Red Dots = Warning BUT Improving. Things are getting better.
- Grey Dots = Neutral. No clear short term trend.
- Yellow Dots = Early. Great for high conviction stocks but early for the main buy signal.
- Dark Green Dots = In the buy zone but losing strength.
- Green Dots (Green Cloud) = Trend is bullish & stock is in the buy zone.
- Trend Line = Shows the prevailing direction of price and if the momentum is beamish, bullish or neutral.
----- Buy & Sell Signals
- Early Buy Bubble= The first day the Early Buy signal is triggered. Early Buy Signals occur below the zero line and are higher risk/reward. This is a unique feature of this indicator.
- Buy Bubble = Indicator Buy Signal Triggered. Buy Signals occur above the zero line.
- Sell Bubble = Indicator Sell Signal Triggered.
----- Ways To Use The Indicator
1. Buy/Sell during with the main buy and sell Alerts in the Buy (green shaded) and Warning (red shaded) zones.
2. In The Red You’re Dead. Most buy signals happen outside of the red warning zone. There are exceptions like reversals and momentum squeezes.
3. Buy Sell Indicator can be used by itself or with other indicators (Momentum Dream works well)
4. Use Red and Green Clouds/Shading to assist with position direction. In the buy zone look to go long. In the red zone generally do not add to your position or consider selling.
5. Use Red Clouds to tighten stops or close positions.
6. Customize the indicators to vary the results by selecting Wilders, SMA, EMA, WMA, and HullMA moving averages.
7. The early buy signal/bubble appears on the chart the first day the early buy signal is triggered and can be used for entry into high conviction stocks or if you want to take a higher risk/reward trade.
8. The standard buy signal is shown when conditions have been met to indicate a better buy entry point with less risk.
Disclaimer: The information contained in our scripts/indicators/ideas does not constitute financial advice or a solicitation to buy or sell any securities of any type. We will not accept liability for any loss or damage, including without limitation any loss of profit, which may arise directly or indirectly from the use of or reliance on such information. All investments involve risk, and the past performance of a security, industry, sector, market, financial product, trading strategy, or individual’s trading does not guarantee future results or returns. Investors are fully responsible for any investment decisions they make. Such decisions should be based solely on an evaluation of their financial circumstances, investment objectives, risk tolerance, and liquidity needs.
Please Use the link below for more information.
Transactional Rate of Change (TROC)TRANSACTIONAL RATE OF CHANGE (TROC) INDICATOR
Transaction Rate of Change (TROC) is an advanced momentum indicator that analyzes the rate of change in cumulative inferred buy/sell volume data to identify shifts in buying and selling acceleration and deceleration of transaction flow, providing early signals of potential trend changes, exhaustion/absorption, and momentum shifts. It builds further upon the official Volume Delta indicator released by TradingView.
If a stock price is a rocket climbing , then volume delta is the total fuel burned, and TROC is the fuel burn rate . A rocket can keep rising even after engines start throttling down (decelerating TROC), but it won't go much higher without more thrust. When TROC shows extreme positive readings, the engines are at maximum burn—expect explosive price movement. When TROC drops to zero while price is still high, the fuel is depleted and gravity (selling pressure) takes over. Are buyers pushing on the gas, or are they backing off? Are more buyers coming to the table, or are they losing interest or taking profits? Are excited retail buying highs while smart money close their positions using the excited retail liquidity?
KEY FEATURES
• Volume Delta Analysis - Approximates up and down volume from lower timeframe data to calculate true buying vs. selling pressure.
• Rate of Change Calculation - Measures the momentum of cumulative delta over a customizable period. Essentially, it displays the rate of change between buying and selling. How fast is it going, is it slowing, how excited are they?
• Momentum State Detection - Automatically identifies four distinct market states: accelerating up, decelerating up, accelerating down, and decelerating down
• Extreme Threshold Zones - Bands based on standard deviation to highlight unusually high or low transaction rates, helping to spot potential extreme values, blow offs, and capitulation.
• Z-Score Normalization - Optional standardization for comparing momentum across different timeframes and instruments.
• Momentum Strength Index (MSI) - Filters out weak signals by highlighting only bars with momentum exceeding a threshold.
• Flexible Reset Modes - Reset cumulative delta daily, weekly, monthly, or per session to prevent data drift, or leave it default for continual cumulative data.
APPLICATION
Trend Confirmation
When price makes a new high but TROC is decelerating (lighter colors), it suggests weakening buying pressure and potential exhaustion. Conversely, strong acceleration (darker colors) confirms robust trend continuation. Either buyers are supporting the move, or they aren't. Same goes for selling. It can also assist spotting short covering.
Divergence Trading
Use it similar to MACD divergence strategies. Is price movement confirmed by expansion in TROC, or is the TROC showing weakness while price is continuing it's trend?
Momentum Breakouts
When TROC crosses above the upper threshold zone with strong momentum (MSI activated), it signals institutional-level buying that often precedes significant price moves. Use this for breakout entries.
Mean Reversion
Extreme readings beyond the threshold zones often precede short-term reversals as transaction rates normalize. Consider taking profits or counter-trend positions when TROC reaches statistical extremes. Utilizing the extreme threshold bands can help you identify tops and bottoms.
Absorption Detection
Spot areas where buying or selling is being done, but price is hitting a wall or floor and not moving. This can indicate a hidden seller or a buyer reloading at price levels/zones.
SETTINGS
Timeframe for Volume Delta Calculation
Select the lower timeframe used to calculate buying and selling volume. Default: 1S (1 second)
• 1S or 5S - Maximum precision for scalping and intraday trading on liquid markets
• 1m or 5m - Balanced precision for swing trading and less liquid instruments
• Higher timeframes - Provide more historical data but reduce accuracy
Note: Higher frequency data yields more accurate delta calculations but may not be available for all symbols or historical periods. If you are using higher timeframes (Daily, Weekly) you will need to change this setting to a higher timeframe.
Rate of Change Period
Determines how many bars back to measure the momentum change. Default: 14
• Short periods (7-10) - More responsive, ideal for scalping and quick momentum shifts
• Medium periods (14-20) - Balanced sensitivity for day trading
• Long periods (25-50) - Smoother readings for swing trading and trend analysis
Shorter periods generate more signals but increase false positives; longer periods reduce noise but may lag significant changes.
Extreme Threshold Zones
Bands that highlight unusual transaction rate extremes based on standard deviation.
• Show Zones - Enable/disable the upper and lower threshold lines (Default: Enabled)
• Multiplier - Standard deviation multiplier for zone placement (Default: 2.0)
Values of 1.5-2.0 catch moderate extremes
Values of 2.5-3.0 identify only the most extreme readings
• Lookback Period - Number of bars used to calculate mean and standard deviation (Default: 100)
Shorter lookback (50-75) adapts faster to changing market conditions
Longer lookback (150-200) provides more stable, consistent zones
Smooth Cumulative Delta
Applies Adaptive Moving Average to reduce noise in the cumulative volume delta before calculating rate of change. Default: Enabled
• Smoothing Length - period (Default: 5)
Lower values (3-5) preserve responsiveness
Higher values (7-10) significantly reduce noise on choppy markets
Smoothing is particularly useful on volatile instruments or when using very short ROC periods.
Momentum Strength Index (MSI)
Filters the histogram to highlight only bars exceeding a specified momentum threshold, eliminating weak signals.
• Show MSI - Enable/disable momentum strength filtering (Default: Disabled)
• MSI Threshold - Minimum momentum strength multiplier (Default: 2.0)
Values of 1.5-2.0 show above-average momentum
Values of 2.5-3.5 isolate only exceptional momentum bars
When enabled, bars meeting the threshold display in the "Strong Up/Down" colors, while normal bars use standard momentum colors.
Display Settings
• Histogram Bar Width - Visual thickness of the columns (Default: 1, Range: 1-10)
• Use Z-Score Normalization - Standardizes TROC values for cross-asset comparison (Default: Disabled)
Enable when comparing multiple instruments or timeframes simultaneously
Z-Score converts values to standard deviations from the mean
• Z-Score Threshold - When using Z-Score Normalization mode, sets the extreme zone levels (Default: 2.0)
Represents standard deviations from mean (2.0 = ~95% confidence interval)
Cumulative Transaction Reset
Determines when the cumulative volume delta resets to zero, preventing infinite accumulation. Default: None
• None - Cumulative delta never resets (continues from symbol history start)
• Daily - Resets at the start of each new trading day
• Weekly - Resets at the start of each week
• Monthly - Resets at the start of each month
• On session change - Resets when market opens (useful for 24-hour markets)
Reset modes prevent cumulative drift that can distort ROC calculations over extended periods.
Color Customization Fully customizable color scheme.
-------------------------------------------------------------------
Note: This indicator requires volume data from your data vendor. It uses inferred buy/sell volume. To learn more, read the TradingView Volume Delta documentation. Optimal performance is achieved on liquid instruments with high-frequency data.

Ch Enhanced Buy Sell Volume// ========================================
// 📊 HOW TO READ THIS INDICATOR 📊
// ========================================
//
// 🟢 GREEN BARS (Above Zero) = BUY VOLUME
// 🔴 RED BARS (Below Zero) = SELL VOLUME
//
// 💡 BAR COLORS MEANING:
// • DARK GREEN = Strong buyer dominance (high conviction buying)
// • LIGHT GREEN = Weak buyer dominance (low conviction)
// • DARK RED = Strong seller dominance (high conviction selling)
// • LIGHT RED = Weak seller dominance (low conviction)
//
// 🎯 TRADING SIGNALS:
// • Tall dark green bars = Strong bullish momentum
// • Tall dark red bars = Strong bearish momentum
// • Light colored bars = Weak conviction, potential reversal
// • Green bars > Red bars = Buyers winning
// • Red bars > Green bars = Sellers winning
//
// 📈 BULLISH SIGNALS:
// • Buy% > 70% = Strong buying interest
// • Dark green bars with high delta = Professional buying
// • Buy volume above yellow MA line = Above average buying
//
// 📉 BEARISH SIGNALS:
// • Sell% > 70% = Strong selling pressure
// • Dark red bars with high delta = Professional selling
// • Sell volume below yellow MA line = Above average selling
//
// ⚠️ WARNING SIGNALS:
// • Price up + Red dominance = Bearish divergence
// • Price down + Green dominance = Bullish divergence
// • Low delta (<10%) = Market indecision
//
// 📊 INFO TABLE (Top-Right):
// • Buy%: Percentage of volume that was buying
// • Sell%: Percentage of volume that was selling
// • Delta%: Strength of dominance (difference between buy/sell)
// • Dom: Which side is currently dominant (BUYERS/SELLERS)
//
// 🟡 YELLOW LINES = Volume Moving Average
// • Upper line: Reference for buy volume (green bars)
// • Lower line: Reference for sell volume (red bars)
// • Above yellow = Higher than average volume
// • Below yellow = Lower than average volume

The Signal - Hunt Bitcoin CoT Buy/SellThe Signal - Hunt Bitcoin CoT Buy/Sell
Why Bother with another CoT signal?
Its different & focused on the Insider's. The Largest 4 Open Interest Seller and the Largest 4 open Interest Longs, plus the distance they are apart, the Delta, what does high percentage of Largest 4 sellers mean with a low 4 OI Buyers. , what when the usually higher Sellers are low and the largest 4 buyers almost the same value , Time to track the insiders Delta..
Performance -
This Indicator provided a
1. Signal 1 = 26th March 2019 = SUPER LONG at $4,500 that saw a near $14,000 run up
2. Signal 2 = 18th & 24th June 2019 = SHORT at the second & final level $11,700 after repeated attempts & failure in the $13K range, the mini Echo Bitcoin Bull of 2019
3. Signal 3 = 17th December 2019 = LONG $6,900, Bitcoin rallied to Mid $10,500's
4. Signal 4 = 18th Feb 2020 = SUPER SHORT from $9,700's to a final extreme Low of $3,000, calling the CV-19 collapse
5. Signal 5 = 17th March 2020 = LONG from $5,400 no closure point yet
6. Signal 6 = 29th June 2020 = SUPER LONG reiterate from $10,700 no closure sell signal yet
7. Signal 7 = 17th May 2020 = LONG another accumulate LONG with no sell signal yet generated at Post H&S's low of $33,000
Note - This indicator only commences March 2019, as Bitcoin futures were a recent introduction and needed to settle for 6 months in both use and data, no signals were meaningful prior & data was light.
What is Provided. - Please note the need to also add the Hunt Bitcoin Historical Volatility Indicator for full understanding.
We provide 3 things with the 3 indicators.
'Insider' indications from Largest players in the futures market.
1. Bitcoin Macro Buy Signals.
a) The Bitcoin Commitment of Traders results see us focus solely on Largest 4 Short Open Interest & Largest 4 Long Open Interest aspects of the CoT Release data.
When the difference - is tight, a kind of pinch, these have been great Buy signals in Bitcoin.
We call this difference the Delta & When Delta is 5% or less Bitcoin is a Buy.
2. Bitcoin Macro Sells.
a) A sell signal is Triggered in Bitcoin at any point the Largest 4 short OI > or = to 70
3. AMPLIFIER Trade signals 'Super' Longs or Shorts -
Extreme low volatility events leads to highly impulsive & volatile subsequent moves, if either of 1 or 2 above occur, combined with extreme low volatility
a 'Super Long' or 'SUPER SELL' is generated. In the case of the short side, given Bitcoins general expansive and MACRO Bull trend since inception, we seek an additional component
that is an extreme differential/Delta reading between 4 biggest Longs & Shorts OI.
Namely CoT Delta also must be > 47.5%
We also have a Cautionary level, where it is not necessarily a good idea to accumulate Bitcon, as a better opportunity lower may avail itself, see conditions below.
So the required logic explicitly stated below for all Signals.
1. Long - Hunt Bitcoin CoT Delta < or = 5
2. SUPER Long - Hunt Bitcoin CoT Delta < or = 5; and 2 Day Historical Bitcoin Volatility = or < 20
3. Short - Largest 4 Sellers OI = or > 70
4. SUPER Short - Largest 4 Sellers OI = or > 70; AND..
Hunt Bitcoin CoT Delta = or > 47.5 AND 2 Day Historical BTC Volatility = or < 20
5. Caution - Largest 4 Sellers OI = or > 67.5 AND Hunt Bitcoin CoT Delta = or > 45
WARNING SEE Notes Below
Note 1 - = Largest 4 Open Interest Shorts
Note 2 - = Largest 4 Open Interest Longs
Note 3 - = Hunt Cot Delta = (Largest 4 sellers OI) -( Largest 4 Buyers OI)
Caution = Avoid new Bitcoin Accumulation Right Now, A sell signal might follow Enter on next Long
Note 4 - The Hunt Bitcoin COT Delta signal is a Largest 'Insider' Tracking tool based on a segment of Commitment of Traders data on Bitcoin Futures, released once a week on a Friday.
It is a Macro Timeframe signal , and should not be used for Day trading and Short Timeframe analysis , Entries may be optimised after a Hunt Bitcoin CoT Signal is generated by separate shorter Timeframe analysis.
Note 5 - The Historical Bitcoin Volatility is an additional 'Amplifier' component to the 'Hunt Bitcoin Cot Delta' Insider Signal
Note 6 - The Historical Bitcoin Volatility criteria varies by timeframe, the above levels are those applying on a Two Day TF Chart, select this custom timeframe in Trading View.
if additional criteria are met for LONG & SHORT insider signals, they may become 'Super Longs/Shorts', see conditions box above.

#1 Vishal Toora Buy/Sell Table#1 Vishal Toora Buy/Sell Table
A multi-range volume analysis tool that tracks Short, Medium, and Long-term volume activity directly from recent candles.
It calculates Buy and Sell volumes for each range, shows their Delta (difference), and generates a combined Signal (Buy / Sell / Neutral) based on all active ranges.
Each column and the Signal row can be switched ON/OFF for custom clarity.
🧠 What the Numbers Represent (Candle Connection)
Each number represents total volume from a group of candles:
The script looks back a certain number of candles in each range (e.g., 2–3 candles for Short, 10–20 for Medium, 50–100 for Long).
It measures how much volume occurred on bullish candles (Buy) vs bearish candles (Sell).
Buy Volume (Green Numbers):
Volume from candles where price closed higher than it opened → bullish pressure.
Sell Volume (Red Numbers):
Volume from candles where price closed lower than it opened → bearish pressure.
Delta (White or Yellow Numbers):
The difference between Buy and Sell volumes within that range.
Positive → More bullish volume.
Negative → More bearish volume.
Larger absolute values = stronger imbalance between buyers and sellers.
Signal Row:
Summarizes all ranges’ deltas:
🟢 Buy → majority of ranges show positive delta.
🔴 Sell → majority show negative delta.
⚪ Neutral → roughly balanced or mixed candle behavior.
🎯 In Simple Terms
Each number in the table is a summary of what recent candles did —
it converts multiple candles’ volume data into clean, readable signals,
so you instantly see who’s in control (buyers or sellers) across short, medium, and long perspectives.
© 2025 Vishal Toora — counting volumes so you don’t have to.
Buy or Sell... or just stare at the screen.
Making deltas speak louder than your ex. 💀
Disclaimer:
This indicator is for educational and informational purposes only.
It does not guarantee accuracy or performance.
You are solely responsible for your trading decisions.

Multiple (12) Strong Buy/Sell Signals + Momentum
Indicator Manual: "Multiple (12) Strong Buy/Sell Signals + Momentum"
This indicator is designed to identify strong buy and sell signals based on 12 configurable conditions, which include a variety of technical analysis methods such as trend-following indicators, pattern recognition, volume analysis, and momentum oscillators. It allows for customizable alerts and visual cues on the chart. The indicator helps traders spot potential entry and exit points by displaying buy and sell signals based on the selected conditions.
Key Observations:
• The script integrates multiple indicators and pattern recognition methods to provide comprehensive buy/sell signals.
• Trend-based indicators like EMAs and MACD are combined with pattern recognition (flags, triangles) and momentum-based signals (RSI, ADX, and volume analysis).
• User customization is a core feature, allowing adjustments to the conditions and thresholds for more tailored signals.
• The script is designed to be responsive to market conditions, with multiple conditions filtering out noise to generate reliable signals.
________________________________________
Key Features:
1. 12 Combined Buy/Sell Signal Conditions: This indicator incorporates a diverse set of conditions based on trend analysis, momentum, and price patterns.
2. Minimum Conditions Input: You can adjust the threshold of conditions that need to be met for the buy/sell signals to appear.
3. Alert Customization: Set alert thresholds for both buy and sell signals.
4. Dynamic Visualization: Buy and sell signals are shown as triangles on the chart, with momentum signals highlighted as circles.
________________________________________
Detailed Description of the 12 Conditions:
1. Exponential Moving Averages (EMA):
o Conditions: The indicator uses EMAs with periods 3, 8, and 13 for quick trend-following signals.
o Bullish Signal: EMA3 > EMA8 > EMA13 (Bullish stack).
o Bearish Signal: EMA3 < EMA8 < EMA13 (Bearish stack).
o Reversal Signal: The crossing over or under of these EMAs can signify trend reversals.
2. MACD (Moving Average Convergence Divergence):
o Fast MACD (2, 7, 3) is used to confirm trends quickly.
o Bullish Signal: When the MACD line crosses above the signal line.
o Bearish Signal: When the MACD line crosses below the signal line.
3. Donchian Channel:
o Tracks the highest high and lowest low over a given period (default 20).
o Breakout Signal: Price breaking above the upper band is bullish; breaking below the lower band is bearish.
4. VWAP (Volume-Weighted Average Price):
o Above VWAP: Bullish condition (price above VWAP).
o Below VWAP: Bearish condition (price below VWAP).
5. EMA Stacking & Reversal:
o Tracks the order of EMAs (3, 8, 13) to confirm strong trends and reversals.
o Bullish Reversal: EMA3 < EMA8 < EMA13 followed by a crossing to bullish.
o Bearish Reversal: EMA3 > EMA8 > EMA13 followed by a crossing to bearish.
6. Bull/Bear Flags:
o Bull Flag: Characterized by a strong price movement (flagpole) followed by a pullback and breakout.
o Bear Flag: Similar to Bull Flag but in the opposite direction.
7. Triangle Patterns (Ascending and Descending):
o Detects ascending and descending triangles using pivot highs and lows.
o Ascending Triangle: Higher lows and flat resistance.
o Descending Triangle: Lower highs and flat support.
8. Volume Sensitivity:
o Identifies price moves with significant volume increases.
o High Volume: When current volume is significantly above the moving average volume (set to 1.2x of the average).
9. Momentum Indicators:
o RSI (Relative Strength Index): Confirms overbought and oversold levels with thresholds set at 65 (overbought) and 35 (oversold).
o ADX (Average Directional Index): Confirms strong trends when ADX > 28.
o Momentum Up: Momentum is upward with strong volume and bullish RSI/ADX conditions.
o Momentum Down: Momentum is downward with strong volume and bearish RSI/ADX conditions.
10. Bollinger & Keltner Squeeze:
o Squeeze Condition: A contraction in both Bollinger Bands and Keltner Channels indicates low volatility, signaling a potential breakout.
o Squeeze Breakout: Price breaking above or below the squeeze bands.
11. 3 Consecutive Candles Condition:
o Bullish: Price rises for three consecutive candles with higher highs and lows.
o Bearish: Price falls for three consecutive candles with lower highs and lows.
12. Williams %R and Stochastic RSI:
o Williams %R: A momentum oscillator with signals when the line crosses certain levels.
o Stochastic RSI: Provides overbought/oversold levels with smoother signals.
o Combined Signals: You can choose whether to require both WPR and StochRSI to signal a buy/sell.
________________________________________
User Inputs (Inputs Tab):
1. Minimum Conditions for Buy/Sell:
o min_conditions: Number of conditions required to trigger a buy/sell signal on the chart (1 to 12).
o Alert_min_conditions: User-defined alert threshold (how many conditions must be met before an alert is triggered).
2. Donchian Channel Settings:
o Show Donchian: Toggle visibility of the Donchian channel.
o Donchian Length: The length of the Donchian Channel (default 20).
3. Bull/Bear Flag Settings:
o Bull Flag Flagpole Strength: ATR multiplier to define the strength of the flagpole.
o Bull Flag Pullback Length: Length of pullback for the bull flag pattern.
o Bull Flag EMA Length: EMA length used to confirm trend during bull flag pattern.
Similar settings exist for Bear Flag patterns.
4. Momentum Indicators:
o RSI Length: Period for calculating the RSI (default 9).
o RSI Overbought: Overbought threshold for the RSI (default 65).
o RSI Oversold: Oversold threshold for the RSI (default 35).
5. Bollinger/Keltner Squeeze Settings:
o Squeeze Width Threshold: The maximum width of the Bollinger and Keltner Bands for squeeze conditions.
6. Stochastic RSI Settings:
o Stochastic RSI Length: The period for calculating the Stochastic RSI.
7. WPR Settings:
o WPR Length: Period for calculating Williams %R (default 14).
________________________________________
User Inputs (Style Tab):
1. Signal Plotting:
o Control the display and colors of the buy/sell signals, momentum indicators, and pattern signals on the chart.
o Buy/Sell Signals: Can be customized with different colors and shapes (triangle up for buys, triangle down for sells).
o Momentum Signals: Custom circle placement for momentum-up or momentum-down signals.
2. Donchian Channel:
o Show Donchian: Toggle visibility of the Donchian upper, lower, and middle bands.
o Band Colors: Choose the color for each band (upper, lower, middle).
________________________________________
How to Use the Indicator:
1. Adjust Minimum Conditions: Set the minimum number of conditions that must be met for a signal to appear. For example, set it to 5 if you want only stronger signals.
2. Set Alert Threshold: Define the number of conditions needed to trigger an alert. This can be different from the minimum conditions for visual signals.
3. Customize Appearance: Modify the colors and styles of the signals to match your preferences.
________________________________________
Conclusion:
This comprehensive trading indicator uses a combination of trend-following, pattern recognition, and momentum-based conditions to help you spot potential buy and sell opportunities. By adjusting the input settings, you can fine-tune it to match your specific trading strategy, making it a versatile tool for different market conditions.
Signal Reliability Based on Condition Count
The reliability of the buy/sell signals increases as more conditions are met. Here's a breakdown of the probabilities:
1. 1-3 Conditions Met: Lower Probability
o Signals that meet only 1-3 conditions tend to have lower reliability and are considered less probable. These signals may represent false positives or weaker market movements, and traders should approach them with caution.
2. 4 Conditions Met: More Reliable Signal
o When 4 conditions are met, the signal becomes more reliable. This indicates that multiple indicators or market patterns are aligning, increasing the likelihood of a valid buy/sell opportunity. While not foolproof, it's a stronger indication that the market may be moving in a particular direction.
3. 5-6 Conditions Met: Strong Signal
o A signal meeting 5-6 conditions is considered a strong signal. This indicates a well-confirmed move, with several technical indicators and market factors aligning to suggest a higher probability of success. These are the signals that traders often prioritize.
4. 7+ Conditions Met: Rare and High-Confidence Signal
o Signals that meet 7 or more conditions are rare and should be considered high-confidence signals. These represent a significant alignment of multiple factors, and while they are less frequent, they are highly reliable when they do occur. Traders can be more confident in acting on these signals, but they should still monitor market conditions for confirmation.
________________________________________
You can adjust the number of conditions as needed, but this breakdown should give a clear structure on how the signal strength correlates with the number of conditions met!

The real breakout indicator CCI + Money Flow + Buy / SellComponents of the indicator
1. CCI (Commodity Channel Index)
The CCI component measures the deviation of the price from its statistical average. It is used to identify overbought or oversold conditions and is integrated into the trend logic to determine potential trend reversals. High values may indicate overbought conditions, while low values could signify oversold situations.
Detailed
The CCI (Commodity Channel Index) used in "The Real Breakout Indicator Hawk" is an enhanced version compared to the traditional CCI, offering several advantages:
1. Weighting and Smoothing Mechanism
In this version, the CCI values are weighted and smoothed using custom parameters (c1, c2, c3), which allows for greater flexibility in adjusting the sensitivity of the CCI to market conditions. This smoothing reduces noise and provides clearer signals compared to the standard CCI, which can be prone to whipsaws in volatile markets.
2. Multi-level Calculation
The indicator uses an array-based approach to calculate multiple variations of CCI values (with p as the parameter for different levels of calculation), which is then combined to create a more robust signal. This multi-level approach allows for capturing different market cycles, unlike the traditional CCI that only uses a single period for calculation.
3. Integration with Moving Averages and Trend Detection
Unlike the original CCI, which is often used in isolation, this version integrates with the trend detection logic by combining it with moving averages and money flow. The enhanced CCI contributes to the broader trend analysis, ensuring that buy/sell signals are not just based on CCI overbought/oversold levels but also validated by moving averages and slope calculations.
4. Trend-Weighted CCI
This version adds weight to recent price action trends, making it more adaptive to current market momentum. The CCI values are influenced by recent high and low prices, adding a trend-following aspect that is missing from the original CCI, which treats all price deviations equally.
This image of EURAD shows for example that when CCI component is green a strong trend is detected which can hold for up to 10 days in this example, ideal for swing trades;
EURAUD 2H
5. Improved Overbought/Oversold Detection
The script incorporates a dynamic overbought/oversold detection zone based on the enhanced CCI. It accounts for market volatility, allowing it to adjust its thresholds (such as the 200 level) more effectively in different market environments. This makes the enhanced CCI better suited for varying market conditions compared to the fixed thresholds of the original CCI.
You can see that the red diamond signal is generated at the absolute top of the price range after which price started to reverse, the detection is based on a cross over value together with Money Flow strength
BTCUSDT 2H
6. Strong Buy/Sell Confirmation
The enhanced CCI works in tandem with other components like Money Flow and Moving Averages to confirm buy or sell signals. This cross-validation makes the indicator less reliant on CCI alone and ensures that the signals generated are stronger and less prone to false positives, which is a common issue with the standalone CCI.
The green diamond buy signal in a strong downtrend is mostly a short retrace of price before continuing down further, yo can use this as an entry signal after the bounce up into an FVG for example. However when price is at a support, meaning price is not moving down further and this occurs this could be a potential reversal signal as shown on the right side on the chart below. FVG is not respected, retested and price continues up.
BTCUSDT 2H
Summary:
In summary, the enhanced CCI in this indicator improves over the original CCI by providing better noise reduction, multi-level analysis, trend integration, and adaptability to different market conditions. These improvements lead to more reliable and actionable trading signals.
2. Money Flow (MF) www.tradingview.com
The Money Flow component tracks the flow of capital in and out of an asset. Positive values indicate strong buying pressure, while negative values show selling pressure. This is smoothed to avoid noise and is used to confirm strong buy or sell conditions.
The Money Flow (MF) in "The Real Breakout Indicator Hawk" measures the flow of capital into or out of an asset, helping to assess the underlying buying or selling pressure in the market.
1. Positive Money Flow (Buying Pressure)
When the MF is positive, it indicates that more money is flowing into the asset, which suggests strong buying interest. This helps confirm that a price increase or breakout to the upside is supported by demand.
2. Negative Money Flow (Selling Pressure)
A negative MF indicates that capital is leaving the asset, reflecting selling pressure. This is a sign that the market is under bearish conditions, and prices are likely to decline or break down.
3. Confirmation of Buy and Sell Signals
The MF is used to confirm buy and sell signals generated by other components of the indicator. When the MF aligns with other bullish signals, it strengthens the buy condition, and similarly, when the MF shows strong selling pressure, it reinforces a sell signal.
4. Filtering Noise
The MF is smoothed to filter out noise, ensuring that only significant movements in buying or selling pressure are considered. This helps avoid false signals and makes the MF a reliable tool for detecting true market strength.
5. Range Sensitivity
The MF operates within defined ranges, ensuring that buy or sell signals are only triggered when the flow of money is strong enough, adding precision to signal generation.
In summary, the Money Flow component is crucial for validating market direction, enhancing signal reliability, and helping traders make more informed decisions based on the underlying capital movement in the market.
3. Moving Averages (MA)
Multiple types of moving averages (SMA, EMA, HMA, etc.) are used to smooth price action and highlight the trend direction. The script supports different types of moving averages, and their slopes are calculated to assist in identifying changes in trend momentum.
The Moving Averages (MA) section of "The Real Breakout Indicator Hawk" plays a critical role in smoothing price data, identifying trends, and generating buy/sell signals. Here’s a breakdown of what it does and how you can use it effectively without diving into the script:
1. Moving Average Types
This section allows the user to choose from different types of moving averages, each with unique characteristics:
SMA (Simple Moving Average): Takes the average of closing prices over a specific period. It’s slower and better suited for detecting long-term trends.
EMA (Exponential Moving Average): Gives more weight to recent prices, making it more responsive to new price action and suitable for short-term trading.
HMA (Hull Moving Average): A smoother and faster moving average, useful for reducing lag in fast-moving markets.
LVMA (Linear Weighted Moving Average): Places the most weight on recent prices, making it even more responsive than EMA.
Alma (Arnaud Legoux Moving Average): A smoother version that reduces noise while maintaining responsiveness to recent price action.
2. Smoothing and Trend Detection
The moving average smooths out price data to remove small fluctuations and focuses on the overall trend. When prices are trading above the moving average, it suggests that the market is in an uptrend. When prices are below the moving average, it indicates a downtrend.
3. Trend Confirmation
The moving average serves as a confirmation tool. When the price crosses above the moving average, it could signal the start of a bullish trend, and when the price crosses below, it may indicate the beginning of a bearish trend.
4. Buy and Sell Signals
Buy Signal: The system detects a buy signal when:
The moving average crosses above 0, indicating a potential upward momentum.
Other indicators like Money Flow and CCI align to confirm the trend.
Sell Signal: A sell signal is triggered when:
The moving average crosses below 0, signaling a potential downtrend.
This signal is further validated by other components such as Money Flow and CCI to reduce false signals.
5. Using Moving Averages in Trading
Crossover Strategy: One of the simplest ways to use moving averages is by employing a crossover strategy. For instance:
When the shorter-term moving average (e.g., 20-period) crosses above a longer-term moving average (e.g., 50-period), this is a bullish crossover, indicating a buy signal.
Conversely, when the shorter-term moving average crosses below the longer-term moving average, this is a bearish crossover, indicating a sell signal.
Trend Following: If you’re trading with the trend, you can use a moving average to stay in the trade as long as the price remains above (for long positions) or below (for short positions) the moving average.
Support and Resistance: Moving averages can also act as dynamic support or resistance levels. For example, in an uptrend, the CCI might bounce off the moving average, offering a good entry point for a long position. In a downtrend, the moving average could act as resistance where prices may reverse, offering a shorting opportunity.
To use the MA section effectively:
Choose the right type of moving average based on your trading style (e.g., use EMA for faster response or SMA for long-term trends).
Watch for crossovers as buy/sell signals, especially in combination with other indicators.
Follow the trend by observing whether the price is above or below the moving average.
Use the moving average as a dynamic support/resistance level to find optimal entry/exit points.
This approach makes the moving average a versatile tool for identifying trends, refining entry and exit points, and confirming overall market direction.
an example when MA crosses below 0, keep in mind that when it it starts curving up and turning green there is a reversal brewing, this could take time...
BTCUSDT 2H
4. Buy Signals
Buy signals are generated when the moving average crosses up, and the Money Flow and other trend-based conditions are met, including CCI levels confirming the strength of the breakout. Additionally, slope calculations and other momentum indicators provide extra confirmation for entries.
5. Sell Signals
Sell signals occur when the moving average crosses down, combined with negative Money Flow, confirming downward pressure. Other trend-based conditions, including the CCI, must also align to validate the signal, and slope calculations ensure that momentum is on the sell side.
6. Slope and Trend Detection
The script includes calculations for the slope of price action over a lookback period to measure trend strength and direction. The slope is normalized to help identify when the market is gaining or losing momentum. This slope is used in conjunction with the moving averages and Money Flow to give more accurate trend signals.
The Slope and Trend Detection component in "The Real Breakout Indicator Hawk" is designed to measure the direction and strength of the market’s trend by calculating the slope of the price action over a specific period. This helps to identify whether the market is gaining or losing momentum, and it is a key element in refining buy/sell signals.
Here’s how the Slope and Trend Detection works and how you can use it effectively without diving into the script:
1. Slope Calculation
Slope is essentially the rate of change of the moving average (or price) over a given number of bars. It measures how steeply the price is moving up or down.
The script calculates the slope by measuring the difference between the moving average over a defined number of bars (e.g., 12 bars in this case). A larger slope indicates a stronger trend, while a smaller slope suggests a weaker or consolidating trend.
2. Normalized Slope
The slope is normalized, meaning it is adjusted to fall within a range that makes it easier to compare across different time frames and markets. This normalization helps to gauge whether the slope is strong or weak relative to historical data.
Positive slopes (above 0) indicate an uptrend or rising price momentum, while negative slopes (below 0) indicate a downtrend or falling price momentum.
3. Trend Detection
The slope of the moving average is used to detect the current trend:
If the slope is positive, the market is in an uptrend.
If the slope is negative, the market is in a downtrend.
The stronger the slope (the steeper it is), the stronger the trend. A small slope indicates a weak trend or consolidation.
4. Slope Thresholds
The system uses thresholds to determine the significance of the slope. These thresholds are set as upper and lower bounds:
Upper Threshold: If the slope exceeds this threshold, the trend is considered strong, and it could trigger a buy signal.
Lower Threshold: If the slope falls below this threshold (into the negative range), it indicates a strong downtrend, and it could trigger a sell signal.
These thresholds help filter out weak or false signals that occur in sideways or low-momentum markets.
5. Positive and Negative Slope Arrays
The system keeps track of both positive and negative slopes over a defined lookback period (e.g., 500 bars). By storing these values, it creates a historical context that helps to assess the current slope in relation to past price movements.
It calculates the standard deviation and the average of these slopes to dynamically adjust the thresholds for each market condition, making the trend detection more adaptive to different types of assets or market phases.
6. Using Slope and Trend Detection in Trading
Buy Signal with Positive Slope: When the slope is positive and exceeds a certain threshold, it confirms that the market is in a strong uptrend. This can be used as a signal to enter a long position or add to existing long trades.
Sell Signal with Negative Slope: When the slope turns negative and falls below the lower threshold, it signals a strong downtrend, indicating a potential short-selling opportunity or the time to exit long positions.
Avoiding Flat Markets: If the slope remains close to zero (neither strongly positive nor negative), it suggests a lack of clear trend or a consolidating market. In these conditions, it might be better to avoid taking new trades or use additional filters to confirm signals.
7. Slope-Based Trend Strength Indicator
You can also use the slope as a measure of trend strength:
Strong Trend: When the slope is steep (either positive or negative), it indicates strong momentum, and you can be more confident in holding a trade in that direction.
Weak Trend or Consolidation: When the slope is flat, it indicates weak price momentum, which may signal a period of consolidation or indecision in the market.
8. Visual Representation
The slope is often visually represented as a gradient or line that fluctuates around a central point (usually zero). Positive values are shown in one color (e.g., green for an uptrend), while negative values are shown in another color (e.g., red for a downtrend). This allows traders to quickly identify the current trend direction and its strength.
Summary:
To use Slope and Trend Detection effectively:
Monitor the slope to determine the trend direction (positive = uptrend, negative = downtrend).
Look for thresholds to identify strong trends. For instance, a steep positive slope signals a strong uptrend, while a steep negative slope signals a strong downtrend.
Use slope changes to confirm buy/sell signals. For example, if you receive a buy signal and the slope is positive and increasing, it confirms that momentum is behind the trade.
Avoid low-slope periods when the slope is close to zero, indicating a lack of trend or sideways market conditions.
This approach helps traders stay on the right side of the trend while avoiding periods of low momentum, enhancing the accuracy of trade signals.
7. Banker Fund Flow Trend
This component identifies potential large institutional moves by tracking specific patterns in price and volume data. When the institutional or "banker" entry or exit conditions are met, it highlights these moments with candles and generates alerts.
The Banker Fund Flow Trend in "The Real Breakout Indicator Hawk" helps detect the flow of institutional (or "smart money") into and out of the market by tracking price trends and large player activity. It uses red and yellow candles to signal when institutional money is influencing the market.
Key Points:
Yellow Candles (Banker Entry):
A yellow candle is plotted when institutional money starts flowing into the market.
This signals a potential buy opportunity, as large market players are likely pushing prices upward.
Red Candles (Banker Exit):
A red candle appears when institutional money starts exiting the market.
This is a signal to consider selling or exiting long positions, as institutional selling could drive prices lower.
Usage:
Yellow candles: Use these as signals to enter long trades or add to existing positions, confirming upward momentum driven by institutional buyers.
Red candles: Treat these as signals to exit long trades or consider short positions, as institutional selling may lead to further downside.
BTCUSDT 2H
The yellow and red candles provide clear, actionable signals for aligning trades with institutional flows, ensuring you’re following the "smart money."
8. Dynamic Buy/Sell Calculations
A dynamic component is designed to refine the buy and sell signals further based on additional conditions like price patterns, volatility, and Money Flow. This ensures that signals are more responsive to changing market conditions.
The Dynamic Buy/Sell Calculations in "The Real Breakout Indicator Hawk" are designed to refine entry and exit points for trades by using additional conditions beyond simple crossovers. These calculations adapt to the current market conditions, making them more responsive to changes in volatility, trend strength, and momentum.
Key Features:
Dynamic Buy Calculation:
The indicator generates a buy signal when multiple conditions align. These conditions include the money flow (MF) being within a favorable range, the moving average (MA) confirming upward momentum, and the CCI and other trend components indicating strength.
This makes the buy signal more reliable, as it considers multiple aspects of market behavior (price, momentum, and money flow) to avoid false entries.
Dynamic Sell Calculation:
Similarly, the sell signal is triggered when the dynamic conditions indicate downward momentum.
This includes:
The moving average crossing down.
Negative money flow, suggesting selling pressure.
Other trend signals confirming a bearish move.
The dynamic nature of these conditions ensures that sell signals are only generated when there’s a high probability of continued downside movement.
Adaptive to Market Conditions:
The dynamic nature of these calculations means that the buy/sell signals adapt to market changes, like volatility spikes or sudden trend reversals. Instead of relying on static conditions, the system adjusts to current price movements and volatility.
Avoiding Noise:
By adding multiple filters like MF thresholds, slope, and moving averages, the dynamic calculations help reduce false signals that occur in noisy, sideways markets. This helps traders avoid entering trades during periods of low momentum or unclear trends.
How to Use:
Buy Signals: Use these signals to enter long trades when the dynamic conditions align, confirming that upward momentum is strong and backed by institutional flows.
BTCUSDT 2H
Aqua marker/cross signals (price manipulation/continuation)
BTCUSDT 2H
Sell Signals: Use the sell signals to exit long positions or enter short trades when the market shows signs of bearish momentum, confirmed by multiple conditions like MA crossovers and negative money flow.
BTCUSDT 2H
In summary, the Dynamic Buy/Sell Calculations provide a more sophisticated approach to generating trade signals by combining various trend and momentum indicators, helping traders make more informed decisions in different market conditions.
This part of the code is identifying two key trading signals: moments to buy and moments to sell based on the behavior of a calculated trend line.
Buy Condition:
The system looks for a situation where the trend has been moving downward but has started to reverse upward. Specifically, it checks if the trend was declining a little while ago, then stopped falling, and is now starting to rise. If these conditions are met and the trend is still below a certain level, the system considers this a possible time to buy.
Sell Condition:
The opposite happens for selling. The system monitors for a situation where the trend has been moving upward but starts to turn downward. It checks if the trend was rising, leveled off, and now seems to be starting to fall. If these conditions are met and the trend is above a certain level, this could indicate a good time to sell.
Visual Markers:
To help the user easily see these signals on a chart, the system places symbols at specific points. A marker appears on the chart where the conditions for buying or selling are met, allowing the trader to quickly spot potential entry or exit points in the market.
In summary, this logic is designed to detect possible changes in trend direction and signal appropriate times to consider buying or selling, with clear visual markers on the chart for quick identification.
9. Alerts for Buy and Sell
The indicator provides built-in alert conditions for both buy and sell signals. When these conditions are met, the system generates alerts, making it suitable for automated monitoring.
Each of these components works together to detect potential breakout opportunities, trend continuations, and reversals, making the indicator suitable for both short-term and long-term trading strategies.

Volume Buy/Sell Signals [EdgeTerminal]Volume Signals is an indicator based on volume moving averages and divergence to provide different types of information.
The first signal is the peak volume box shown in red or green, showing the volume peak in an uptrend or downtrend. This usually is a sign of reversal or a slowdown in the trend, depending on the direction of the price.
Peak zones assume that a movement has reached your end for the time being or a new movement is initiated. This cannot be verified by simple volume alone, that's why we have a buy/sell signal feature based on divergence.
The narrow box indicates a continuation of the trend but can be used as support or resistance.
Medium box size usually means the price is in an accumulation phase. This can act as both support and resistance, meaning if the price pushes above, a long position can be taken, and if the price drops below, a short position can be taken.
Large box size indicates a range in which the price will stay shortly. This is usually a sign of high volume volatility and depending on the direction, the price can revisit the area and drop back down or go back up fast. For example, if the large green box appears after a major volume peak and if the price goes above the box, there is a major chance that the price will revisit the box zone and will drop as fast as it went up.
The second signal is a buy/sell signal generated based on the volume divergence and volume numbers compared to average volume values. If the volume is showing signs of lower lows or higher highs, the signal will appear. This indicator is great at generating early entry and exit signals.
Additionally, the script can generate LP (lower possibility) buy/sell signals. Usually, the script looks for two moving average lower lows in volume to generate a signal but when this is turned on, the indicator will also show single confirmed (we call them lower possibility) signals. This is useful when there are not enough signals generated on screen and you want to see more data points.
The settings:
Volume Peak MA: Sets the moving average of the volume peak,
Volume Peak Box Length: Defines the box display length of the volume box across the chart
Volume Box Threshold: Threshold of volume peak detection. A lower number generates more signals and a higher number generates fewer.
First Signal MA Length: First moving average length used in the calculation of the volume signals
Second Signal MA length: Second moving average length used in the calculation of the volume signals
Volume Lookback Right: How many bars to look back on the right side (forward) to confirm the signal
Volume Lookback Left: How many bars to look back on the left side (behind) to confirm the signal
Max Lookback Range: Max lookback range for the KNN machine learning volume data of signal generation.
Min Lookback Range: Minimum lookback range for the KNN machine learning volume data of signal generation.
Show Buy Signals: It shows or hides buy signals.
Show LP Buys: It shows or hides lower possibility buy signals.
Show Sell Signals: It shows or hides sell signals.
Show LP Sells: It shows or hides lower possibility sell signals.

Crodl Pump & DumpThe reason why this indicator is called Pump and Dump is because it is based on volume.
The indicator focuses on volume levels to see if there is an increase in volume before deciding if it is worth entering a Position.
Long example = This will use ATR and price averages to trend Bullish and once the trend favours the upside it will then look at the Volume candles and if a candle is bigger then the average volume and the trend (ATR) is above a certain level it will then Give us a long entry if those conditions are true. We can have more than one long after one another since it will give us a position every-time the conditions are true and after TP(take profit) 1 or a Stop Loss was hit.
Short example = If the trend based on average price is trending downwards and we can see an increase of volume it will wait till we break a certain level breaks when we get the average price from the highs and Lows, then once the trend has met the bearish conditions it will wait for increase in volume and trigger a Sell. The sell will close once TP(take profit) 1 or a Stop Loss is hit.
In the inputs you can adjust the MA (moving average length. This helps to decide if the Trend is bearish or bullish. Higher moving averages will give you less entries and a lower moving average will give you more entries ,since price crosses lower MA's more it will change the trend more often.
Sensitivity is a divider of the MA values is so the higher the Sensitivity the lower the more trades you get since the trend is changing faster.
You will see that there is a backtesting panel on your chart when you look in the inputs there will be a statistics tab which will have 1. Simple 2. Mobile 3. Hide options
1. Simple is designed when you are using a PC or Laptop
2.Can be used when you are using your mobile it will show less data but won't be in your way
3.This will hide the backtesting panel on your screen.
Exit strategy.
there are 3 Types of exits for this indicator.
1 .CrodlExit which is ATR indicator based Exit with a divider.
2 . fIxed SL , this works in % so 1 = 1% market move.
3 .Reverse exits = Longs exit shorts and shorts exit longs.
there are 4 take profit targets and all of them are adjustable.
1= 0.5% by default
2=1% by default
3=1.5% by default
4=2% by default
on the Back tester you will find the following information :
Timeframe of your chart and then the Symbol or pair you are trading.
First trade = when the back tester starts to read data.
Total trade = Total buy and total sell signals and then total trades are buy + sell signals.
total win = total buys hit take profit 1 and total sells that hit take profit 1 and then total buy + total sells that hit take profit 1.
total loss = total buys that hit which ever exit mode you selected in the inputs by default it is crodl exit and total sells that hit which ever exit mode you selected in the inputs by default it is crodl exit and then you will get total buy losses + total sell losses to get total loss.
TP1= the % difference between total trades won and lost for the 1st take profit target and your stop loss method you chose.
TP2= the % difference between total trades won and lost for the 2nd take profit target and your stop loss method you chose.
TP3= the % difference between total trades won and lost for the 3rd take profit target and your stop loss method you chose.
TP4= the % difference between total trades won and lost for the 4th take profit target and your stop loss method you chose.
average win streak give you the average of how many winning trades you had every time before hitting a stop loss.
average loss streak is how many stop loss you hit on average before take profit one has been reached.
longest win streak give you the amount of winning trades you had without hitting a stop lossl that is selected in your inputs.
longest loss streak give you the amount of losing trades you had one after the other before hitting take profit 1.

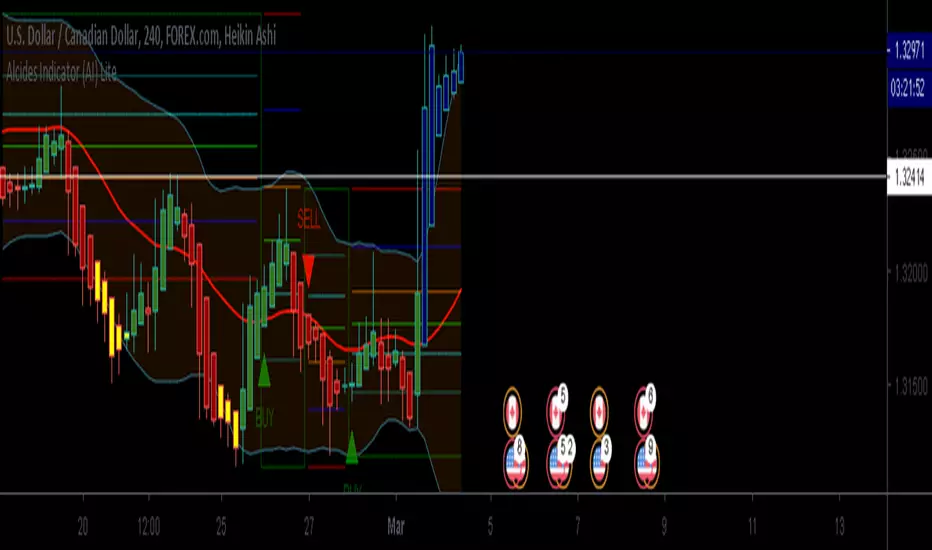
Alcides Indicator(AI) LiteAlcides Indicator (AI) Lite is a simple to use indicator that can be used with any type of asset, trading in any market including FOREX, Stocks, Commodities, Cryptocurrencies etc. The Lite version uses levels from either 1 hr or 4 hr time frame based on user input to indicate entry (BUY) into or exit (SELL) from an asset. The indicator also plots support for BUYs and Resistance for SELLs which can be used as a reference while setting your Stop Loss. BUY, SELL and TAKE GAINS alerts can be set on trading view to help monitor the asset as well.
Even though the indicator signals BUYs and SELLs based on chosen Time Frame levels, the user must always use their discretion based on their TA and FA. Also, indicator repainting can occur based on time of signal/chart used (ex. 5m chart on 1 hr timeframe levels can repaint a BUY/SELL after 1 hr closes).
Works best with Heikin Ashi candles and lower timeframes like 5m, 15m, 30m.
The full version has more time frame levels to choose from, a few extra useful features and also recommends sell and buy levels based on the chosen time from.
Contact me for access and more information.
Custom Buy/Sell Pattern BuilderAre you tired of using trading indicators that only let you follow fixed, pre-designed rules? Do you wish you could build your own “Buy” or “Sell” signals, experiment with your own ideas, or see instantly if your unique pattern works—without learning coding or hiring a developer?
The Custom Buy/Sell Pattern Builder is designed for YOU.
This TradingView indicator lets ANY trader—even a complete beginner—define exactly what kind of price and volume conditions should create a BUY or SELL label on any chart, in any market, at any timeframe.
You don’t need to know programming. You don’t need to know the definition of a hammer, doji, volume spike, or Engulfing pattern.
With a few clicks and easy dropdown choices, you can:
Make your own rules for buying or selling
Choose how many candles your pattern should look at
Decide if you want the biggest body, the lowest volume, the biggest movement, or any combination you can imagine
The result?
You’ll see clear “BUY” or “SELL” labels automatically show up on your chart whenever the exact rule YOU built matches current price action.
No more guessing. No more forced strategies. Just pure control and visual feedback!
Why Is This Powerful?
Traditional indicators (like MACD, RSI, or even classic candlestick scanners) work the same for everyone—and only as their inventors defined.
But every trader, and every market, is unique.
What if you could say:
“Show me a ‘SELL’ every time the newest candle is bigger than the one before, but with LESS volume, while the bar before that had an even smaller body—but more volume than all others?”
With this tool, it’s EASY!
You simply pick which candle you want to compare (most recent, previous, etc), what to compare (body or volume—body means the candle’s “thickness”, from open to close), choose “greater than”, “less than”, or “equal to”, and set a multiplier if you want (like “half as much”, “twice as big”, etc).
After this, if any bar on the chart fits all your rules, it will mark it as a BUY or SELL, depending on your selection.
This means—
Beginners can start experimenting with their intuition or small ideas, without tech hurdles
Experienced traders can visualize and fine-tune any possible logic, before they commit to backtesting or automating a real strategy
Every “what if” or “I wonder” setup is just 2–3 clicks away
How Does It Work? Simple Steps
1. Choose Your Signal Type
“Buy” or “Sell”
This tells the indicator whether to mark the qualifying bars with a green “BUY” or red “SELL” label
2. Pick How Many Candles To Use
“Pattern Candle Count” input (2, 3, or 4)
Example: If you use 4, the pattern will be applied to the most recent 4 candles at every step
3. Define Your Pattern With Inputs
For each candle (from newest “0” to oldest “3”), you can set:
Body Condition (example: “is this candle’s body bigger/smaller/equal to another?”)
Pick which candle to compare against
Pick “>”, “<”, “>=”, “<=”, or “=”
Set a multiplier if needed (like “0.5” to mean “half as big as” or “2” for “twice as big as”)
Volume Condition (exact same choices, but based on trading volume—not the candle’s price body)
For example:
“Candle0 Body > Candle2 Body”
means “the latest candle’s real-body (open–close) is bigger than the one two bars ago.”
“Candle1 Volume <= Candle2 Volume”
means “the previous candle’s volume is less than or equal to the volume of the bar two periods ago.”
You can leave a comparison blank if you don’t want to use it for a particular candle.
What Happens After You Set Your Rules?
Every bar on your chart is checked for your logic:
If ALL body AND volume conditions are true (for each candle you specified),
AND
The signal side (“Buy” or “Sell”) matches your dropdown,
Then a green “BUY” or red “SELL” label will show right on the bar, so you can visually spot exactly where your logic works!
Practical Example:
Suppose you want an entry setup that is:
“Sell whenever the newest candle’s body is bigger than two bars ago, body before that is bigger than three bars ago, AND the newest candle’s volume is less than or equal to two bars ago, AND the candle three bars ago’s volume is less than or equal to half the candle two bars ago’s volume.”
You’d set:
Pattern Candle Count: 4
Side: Sell
Candle0 Body Ref#: 2, Op: >, Mult: 1
Candle1 Body Ref#: 3, Op: >, Mult: 1
Candle0 Vol Ref#: 2, Op: <=, Mult: 1
Candle3 Vol Ref#: 2, Op: <=, Mult: 0.5
And the script will find all “SELL” bars on your chart matching these conditions.
Inputs Section: What Does Each Setting Do?
Let’s break down each input in the indicator’s Settings one by one, so even if you’re new, you’ll understand exactly how to use it!
1. Pattern Candle Count (2–4)
What is it?
This sets how many candles in a row you want your rule to look at.
Example:
“4” means your rules are based on the most recent candle and the 3 before it.
“2” means you are only comparing the current and previous candles.
Tip:
Beginners often use 4 to spot stronger patterns, but you can experiment!
2. Signal Side
What is it?
Choose “Buy” or “Sell”. The word you pick here decides which colored label (green for Buy, red for Sell) appears if your pattern matches.
Example:
Want to spot where “Sell” is likely? Pick “Sell”.
Change to “Buy” if you want bullish signals instead.
3. Body & Volume Comparison Settings (per Candle)
For each candle (#0 is newest/current, #3 is oldest in your pattern window):
Body Comparison
Candle# Body Ref#
Choose which other candle you want to compare this one’s body to.
“0” = newest, “1” = previous, “2” = two bars ago, “3” = three bars ago
Candle# Body Op (Operator; >, <, >=, <=, =)
How do you want to compare?
“>” means “greater than” (is bigger than)
“<” means “less than” (is smaller than)
“=” means “equal to”
Candle# Body Mult (Multiplier)
If you want relative comparisons. For example, with Mult=1:
“Candle0 body > Candle2 body x 1” means just “0 is larger than 2.”
“Candle0 body > Candle2 body x 2” means “0 is more than double 2.”
Volume Comparison
Candle# Vol Ref# / Op / Mult
Exact same logic as body, but works on the “Volume” of each candle (how much was traded during that bar).
How to Set Up a Rule (Step by Step Example)
Say you want to mark a Sell every time:
The most recent candle’s real body is BIGGER than the candle 2 bars ago;
The previous candle’s body is also BIGGER than the candle 3 bars ago;
The current candle’s volume is LESS than or equal to the volume of candle 2;
The previous candle’s volume is LESS than or equal to candle 2’s volume;
The candle 3 bars ago’s volume is LESS than or equal to HALF candle 2’s volume.
You’d set:
Pattern Candle Count: 4
Side: "Sell"
Candle0 Body Ref#: 2, Op: “>”, Mult: 1
Candle1 Body Ref#: 3, Op: “>”, Mult: 1
Candle0 Vol Ref#: 2, Op: “<=”, Mult: 1
Candle1 Vol Ref#: 2, Op: “<=”, Mult: 1
Candle3 Vol Ref#: 2, Op: “<=”, Mult: 0.5
All other comparisons (operators) can be left blank if you don’t want to use them!
When these rules are met, a bright red “SELL” label will appear right above the bar matching all your conditions.
Practical Tips & FAQ for Beginners
What does “body” mean?
It’s the “true range” of the candle: the difference between open and close. This ignores wicks for simple setups.
What does “volume” mean?
This is the total trading activity during that candle/bar. Many traders believe that patterns with different volume “meaning” (such as low-volume up bars, or high-volume down bars) signal a meaningful change.
What if nothing shows on chart?
It just means your current rules are rarely or never matched! Try making your comparisons simpler (maybe just 2-body and 2-volume conditions to start).
You can always hit “Reset Settings” to go back to default.
Can I use this for both buying and selling?
YES! You can detect both bullish (Buy) and bearish (Sell) custom conditions; just switch “Signal Side.”
Do I need to know coding?
Not at all! Everything is in simple input panels.
Creative Use Cases, Example Recipes & Troubleshooting
Creative Ways to Use
Spotting Reversals
Example:
Buy when: the newest candle body is LARGER than the previous 3 bars, but ALL volumes are lower than their neighbors.
Why? Sometimes, a big candle with surprisingly low volume after a sequence of small bars can signal a reversal.
Finding Exhaustion Moves
Example:
Sell when: the current bar body is twice as big as two bars ago, but volume is half.
Why? A very big candle with very little volume compared to similar bars may show the move is “running out of steam.”
Custom “Breakout + Confirmation” Patterns
Example:
Buy when:
Candle 0’s body is greater than Candle 2’s by at least 1.5x,
Candle 0’s volume is greater than Candle 1 and Candle 2,
Candle 1’s volume is less than Candle 0.
Why? This could catch strong breakouts but filter out noisy moves.
Multi-bar Bias/Squeeze Filter
Use “Pattern Candle Count: 4”
Set all 4 volume conditions to “<” and each reference to the previous candle.
Now, a BUY or SELL only marks when each bar is “dryer”/less active than the last — a classic squeeze or low-volatility buildup.
Troubleshooting Guide
“I don’t see any Buy/Sell label; is something broken?”
Most likely, your rules are too strict or rare! Try using only two comparisons and leave other “Op” inputs blank as a test.
Double-check you have enough candles on the chart: you need at least as many bars as your pattern count.
“Why does a label appear but not where I expect?”
Remember, the script checks your rules for every NEW candle. The candle “0” is always the most recent, then “1” is one bar back, etc.
Check the color and type chosen: “Signal Side” must be “Buy” for green, “Sell” for red.
“What if I want a more complex pattern?”
Stack conditions! You can demand the body/volume of each candle in your window meet a different rule or all follow the same rule in sequence.
Mini Glossary — For Newcomers
Candle/Bar: Each bar on the chart, shows price movement during a fixed time (e.g., one minute, one hour, one day).
Body: The colored (or filled) part of the candle — the open-to-close price range.
Volume: How much of the asset was actually traded that candle/bar.
Reference Index: When you pick “2” as a reference, it means “the candle two bars ago in the pattern window.”
Operator (“Op”): The math symbol used to compare (>, <, =, etc).
Signal Side: Whether you want to highlight bullish (“Buy”) or bearish (“Sell”) bars.
Tips for Getting More Value
Start Simple—try just one or two conditions at first. See what lights up. Slowly add more logic as you get comfortable.
Watch the chart live as you change settings. The labels update instantly—this makes strategy design fast and visual!
Try flipping your ideas: If a certain pattern doesn’t work for buys, try reversing the direction for possible “sell” setups.
Remember: There is NO wrong idea. This indicator is only limited by your creativity—it’s a “strategy playground.”
Example Quick-Start Recipes
Classic Sell:
4 candles, side = Sell
Candle0 Body > Candle2; Candle1 Body > Candle3
Candle0 Vol <= Candle2; Candle1 Vol <= Candle2; Candle3 Vol <= Candle2 × 0.5
Simple Buy After Pause:
3 candles, side = Buy
Candle0 Body > Candle1; Candle0 Vol > Candle1
All other Ops blank
Low-Volume Pullback for Entry:
4 candles, side = Buy
Candle0 Body > Candle2
Candle0 Vol < Candle1; Candle1 Vol < Candle2; Candle2 Vol < Candle3
Final Words
Think of this as your “pattern lab.” No code, no guesswork—just experiment, see what the market actually gives, and design your own visual rulebook.
If you’re stuck, reset the script to defaults—it’s always safe to start again!
If you want more ready-made “recipes” for different strategies/styles, just ask and I’ll send some more setups for you.
Happy building—and may your edge always be YOUR edge!

Hassi XAUUSD 15TF BUY/SELL (Anchored, Non-Repainting)What this does
Hassi XAUUSD 15TF BUY/SELL is a non-repainting signal indicator designed for XAUUSD (Gold) on the 15-minute timeframe (also works on BTCUSD). It blends EMA crossover + RSI + MACD with optional volume & volatility filters, and prints anchored BUY/SELL arrows that stay glued to their candle (no visual drifting on zoom/scale/replay). Optional confidence% labels help you judge signal quality at a glance.
Why it’s stable (no repaint)
Signals confirm only on bar close (barstate.isconfirmed).
Arrows/X marks are placed with label.new(x=bar_index, y=high/low, xloc.bar_index, yloc.abovebar/belowbar) so they remain exactly above/below the triggering candle.
No request.security for higher-TF lookaheads; no negative offsets.
How signals are generated
Core trigger: EMA(9) crosses EMA(21)
RSI filter (opt): RSI ≥ RSI Buy Min (default 50) for buys; ≤ RSI Sell Max (default 50) for sells
MACD filter (opt): MACD line crosses its signal or histogram sign matches direction
Volume/ATR filters (opt): require a basic volume spike and above-average ATR volatility (toggleable)
Divergence (opt): lightweight RSI divergence hints (diamond marks)
Anchored markers
BUY: triangle below the signal candle
SELL: triangle above the signal candle
EXIT (❌): small x above (long exit) / below (short exit) when the opposite signal confirms
Nudges: fine-tune vertical placement with tick offsets (inputs) without breaking anchoring
Inputs (defaults)
Fast EMA: 9
Slow EMA: 21
RSI Length: 14
MACD Fast/Slow/Signal: 12 / 26 / 9
Require RSI filter (50 line): ✅
Require MACD cross filter: ✅
RSI Buy Min / RSI Sell Max: 50 / 50
Buy/Sell/Exit Offset (ticks): 0 / 0 / 0
Advanced toggles: Trend Strength ✅, Dynamic Sizing (visual) ✅, Volume Filter ⛔, Volatility Filter ⛔, RSI Divergence ⛔, Show Confidence ✅
Status line/table: ✅
Alerts
Add any of these in Add Alert → Condition: this indicator
Buy Signal → {{ticker}} BUY @ {{close}} - ANCHORED SIGNAL
Sell Signal → {{ticker}} SELL @ {{close}} - ANCHORED SIGNAL
Exit Mark → {{ticker}} EXIT @ {{close}} - ANCHORED EXIT
Recommended use (15-minute XAUUSD)
Use during active sessions (London/NY overlaps).
Keep defaults; enable Volume & Volatility filters in high-noise conditions.
Add confluence (S/R, structure/BOS, session highs/lows, FVG or HTF bias).
Manage risk with structure-based SL or ATR x 1.0–1.5, and partial TP at 1:1–1.5R.
Note: You mentioned it has ~80% win rate on 15TF in your testing. Performance varies by broker feed, session, spread, and risk management. Treat results as educational, not a guarantee.
Non-repainting notes
Signals lock on close; historical arrows are final.
Labels are bar/price anchored (no drift when you zoom or change scale).
Arrays trim old labels automatically to avoid drawing limits.
FAQ
Q: Why don’t past arrows move when I resize the chart?
A: They’re label.new() anchored to bar_index and bar high/low with xloc/yloc, so they stay with the candle.
Q: Can I turn it into a strategy/backtest?
A: Yes—wrap the same signals into strategy.entry/exit, but this release is an indicator by design.
Q: Will it work on BTC or other pairs/timeframes?
A: Yes, but it’s tuned for XAUUSD M15. Adapt filters for other markets.
Changelog
v1.0 — Initial public release: anchored non-repainting arrows, optional RSI/MACD filters, volume/ATR filter, divergence hints, confidence labels, status panel, alerts.
Disclaimer
This tool is for education and analysis only. It is not financial advice. Trading involves risk; do your own research and manage risk responsibly.
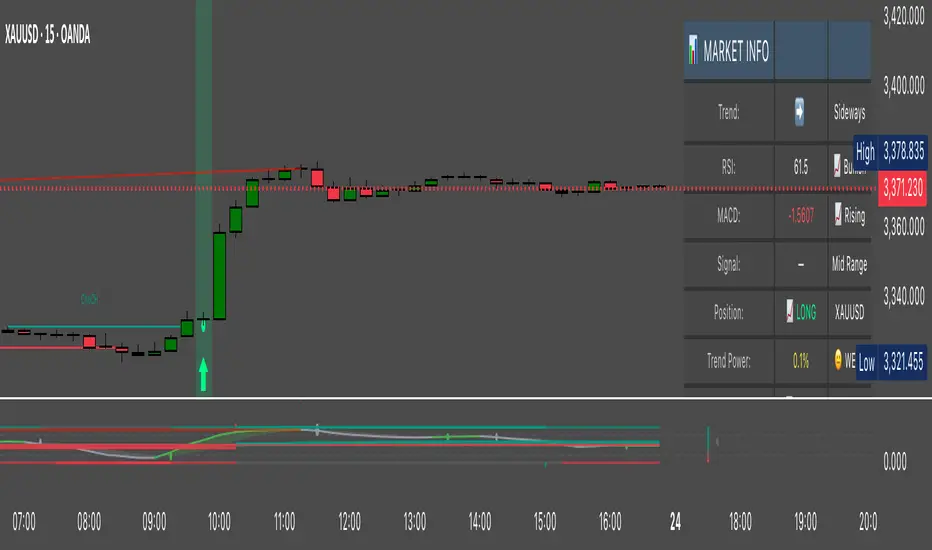
order flow buy/sell and profundity OrderBook Buy/Sell Flow & Polarity Indicator
This powerful indicator provides a detailed look into the market's internal dynamics by visualizing Order Flow (Tape/Time & Sales) and Price Polarity directly on your chart, all within a clean, customizable table. Understand real-time buying and selling pressure and gain insights into who's in control of the candle.
Key Features:
Real-time Order Flow (Tape/Time & Sales): Tracks individual "ticks" (price and volume updates) within the current bar, allowing you to see the immediate impact of buy and sell orders.
Dynamic Table Display: All data is presented in an intuitive, customizable table that can be positioned anywhere on your chart.
Aggregated Buy/Sell Volume: Clearly distinguishes between volume driven by buying (price moving up on a tick) and selling (price moving down on a tick).
"Rocket" Order Detection: Highlights unusually large buy or sell orders based on configurable thresholds (in BTC Millions for major cryptos, and Thousands/Millions for others), helping you spot significant institutional or whale activity.
Candle Polarity Section: A dedicated area in the table that shows the percentage of buying vs. selling volume for the entire current candle. The central cell dynamically blends between bullish (green) and bearish (red) colors, visually representing the dominant polarity.
Customizable Aesthetics: Full control over table colors, text colors, font sizes, and individual label colors to match your chart's theme.
Lightweight & Efficient: Designed to run smoothly without significant impact on your chart's performance.
Why Use This Indicator?
Most indicators only show you the result of price action. The "OrderBook Buy/Sell Flow & Polarity" indicator goes deeper, showing you the cause behind the price movement. By understanding the immediate order flow and the underlying buy/sell pressure within each candle, you can:
Identify accumulation or distribution: Spot when smart money might be entering or exiting positions.
Confirm breakouts/breakdowns: See if there's genuine volume behind price moves.
Gauge market sentiment in real-time: Quickly assess who is more aggressive – buyers or sellers.
Improve entry and exit points: Make more informed decisions based on live market activity.
Settings & Customization:
The indicator comes with a comprehensive set of input options, allowing you to fine-tune its appearance and functionality:
Table Position: Choose from various chart locations (Top/Middle/Bottom, Left/Center/Right).
Window Size (Order Flow): Adjust how many recent order flow "ticks" are displayed.
Colors: Personalize all table, text, and label colors.
Rocket Thresholds: Define the volume levels for "rocket" order detection based on asset type.
Polarity Section Toggle: Enable or disable the real-time candle polarity display.
Note: This indicator provides insights based on available real-time tick data from TradingView. While it simulates aspects of order book and tape reading, it is important to remember that direct access to full exchange Level 2 data is not available on TradingView.
Disclaimer: This indicator is for informational purposes only and should not be considered financial advice. Trading involves risk, and past performance is not indicative of future results.

[Pandora's Chambers] BUY/SELL Blocks + Strength FCBased on the secret technique of ATTA,
Traditional price action analysis techniques, such as ICT (Inner Circle Trader), are often based on subjective interpretations and frequently miss the true structure of the market according to the Wyckoff method. The " BUY/SELL Blocks + Strength FC" indicator aims to correct this problem by automatically and accurately identifying buy/sell "blocks" according to Wyckoff principles, calculating volume strength, filtering breached blocks, and displaying precise support and resistance levels.
Indicator Highlights
Buy/Sell Blocks Identification
Uses the ta.pivothigh and ta.pivotlow functions to locate upper and lower pivot points, and draws a "box" between the two points to represent the block.
Each block is automatically extended to the right of the chart (can be disabled in settings) for a fixed number of bars or until the end of the chart.
Colors are configurable: turquoise shades for buy blocks, and purple for sell blocks.
Volume Strength Calculation and Update
In each candle, positive volume (in a rising market) or negative volume (in a falling market) is added to the relevant block.
Displays in percentages which side (buyers/sellers) controls the block: a label on the block shows +XX% or -XX%.
Changes the background color of the box to gray when the net volume flips (e.g., a strong sell block receives a net positive).
Filtering Breached Blocks
Option to automatically filter and remove blocks where the price has closed above the top of the sell block or below the bottom of the buy block, in order to maintain a clean and focused chart.
"Adjusted" Fibonacci Grid
In the last calculated bars, the indicator identifies the nearest high support level (sup) and the nearest low resistance level (res) among all existing blocks.
Based on sup and res, a Fibonacci grid of 0%, 25%, 50%, 75%, and 100% is constructed, automatically updating as the chart progresses.
What is so new here?
Accuracy according to Wyckoff and not personal interpretation: In the Wyckoff method, market oscillations are built on supply and demand balances in precise price gaps. Here, each block is built directly on pivots from a number of bars back, and not on feelings of an "area" as is sometimes done in ICT techniques.
Quantitative measurement of control: The indicator does not settle for a visual identification of a block but calculates for each block the buy volume versus the sell volume, and clearly displays who is in control.
Automatic filtering to maintain relevance: Breached blocks are removed, so only the strong areas that have not yet been closed remain.
Full integration with modern price action: Understanding price movement is measured here objectively, leaving no room for subjective interpretations of "structure breaks" or "diagonal waves" that standard tools do not support.
Why is the existing price action not enough?
Inconsistency in defining supply and demand zones: Many techniques rely on manual marking of "buy zones" only, without fixed criteria (number of bars back, low highs, volume, etc.).
Scarcity of quantitative indicators: Without calculating net volume, it is difficult to know if a particular block is truly supported by the power of buyers or sellers.
Net invalidation of blocks that have been violated: Repeated breaches of support and resistance areas below/above their boundaries confuse the trader, while here they are automatically removed.
The " BUY/SELL Blocks + Strength FC" indicator comes to correct all these shortcomings, and provides the user with an objective, accurate, and quantitative framework for understanding the dynamics of the market and identifying volume-based support and resistance areas, according to the principles of the Wyckoff method.
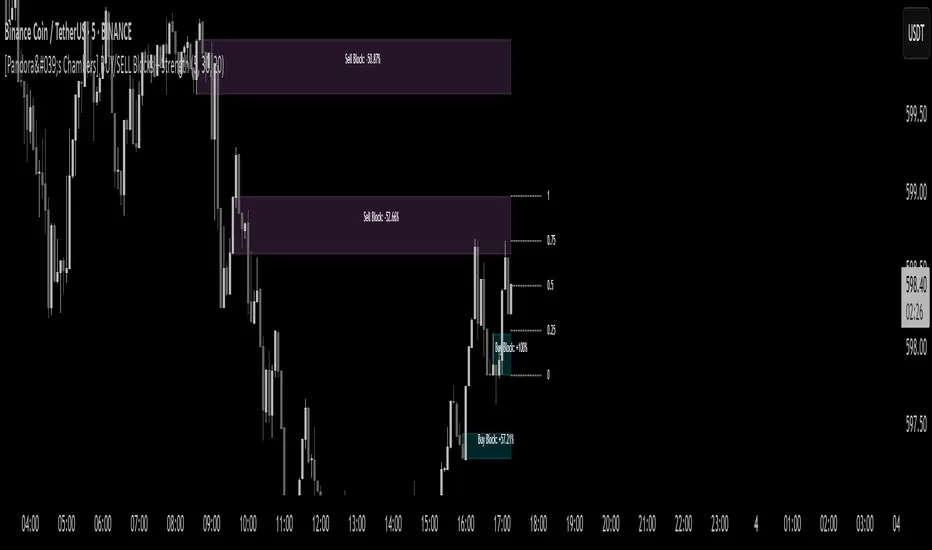
Large Buy/Sell DetectorLarge Buy/Sell Detector
Overview
The Large Buy/Sell Detector is an indicator that uncovers significant buying and selling activity in the markets. Designed to spot unusually large volume spikes, it highlights potential opportunities with customizable filters and visual cues. While not a magic solution, this tool can be a valuable assistant for traders seeking to identify key market moves.
Key Features
- Detects large volume spikes over a user-defined lookback period.
- Displays buy/sell signals with colored dots and optional volume labels.
- Includes filters for trend, candle size, and volume to refine signals.
- Fully customizable settings for colors, dot sizes, and more.
Settings
- *Lookback Period (days):* Set the analysis window (default: 7).
- *Volume Threshold Multiplier:* Adjust sensitivity to volume spikes (default: 2.0).
- *Min Transparency:* Control dot visibility (default: 20).
- *Min Candle Size (% of ATR):* Filter by candle size (default: 0.5).
- *Min Volume in $:* Set a volume threshold in dollars (default: 100,000).
- *Buy/Sell Dot Color:* Choose colors for signals (default: green/red).
- *Dot Size:* Select dot size (default: tiny).
- *Show Volume Labels:* Toggle volume labels (default: enabled).
- *Trend MA Period:* Filter signals by trend (default: 50).
- *Show Large Sell:* Enable sell signals (default: enabled).
Usage
Add the indicator to your chart and tweak the settings to match your trading style. Use it to spot potential large buy/sell activity, but always combine it with your own analysis—this is a helpful tool, not a guaranteed predictor.
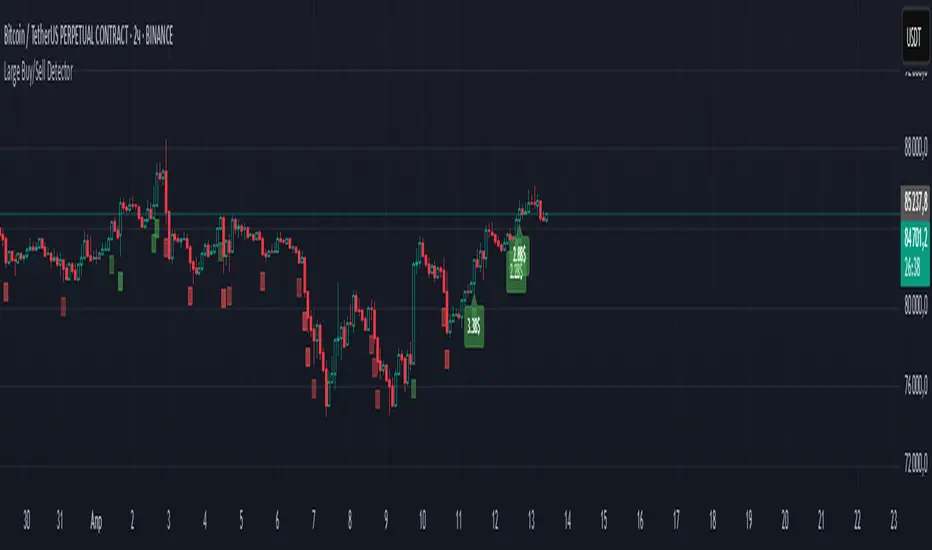
CryptoSignalScanner - Advanced BUY/SELL indicatorDESCRIPTION:
This script has been designed to do some swing trading on 4 hour and daily candles.
After some adjustments it also gives a good result on the lower timeframes 5m, 15m and 1h.
• This scripts is based on RSI, Stoch RSI and some other indicator(s).
• It provides BUY, SELL, STRONG BUY and STRONG SELL labels when loading the script.
• It is also possibility to set a BUY, STRONG BUY, SELL, STRONG SELL, BUY/SELL or STRONG BUY/STRONG SELL alert.
HOW TO USE:
• When a BUY signal appears it means that the trading pair is oversold. Wait for the reversal to buy. Use the Fibonacci tool together with the Eliot Waves Theory to BUY or SELL or wait for the SELL signal.
• When a SELL signal appears it means that the trading pair is overbought. SELL immediately or use the Fibonacci tool together with the Eliot Waves Theory to SELL.
FEATURES:
• You can show/hide the labels based on RSI, Stoch RSI input values.
• You can show/hide the labels based on Stoch RSI K and R input values.
• You can show/hide the labels based on Stoch RSI K and R crossing.
• You can show only STRONG BUY or STRONG SELL labels.
• Etc...
HOW TO GET ACCESS TO THE SCRIPT:
• Use the link below to subscribe to our indicators.
• Based on this script we provide telegram channels that provides signals for all Binance BTC, ETH, USDT and BNB pairs.
REMARKS:
• This advice is NOT financial advice.
• We do not provide personal investment advice and we are not a qualified licensed investment advisor.
• All information found here, including any ideas, opinions, views, predictions, forecasts, commentaries, suggestions, or stock picks, expressed or implied herein, are for informational, entertainment or educational purposes only and should not be construed as personal investment advice.
• We will not and cannot be held liable for any actions you take as a result of anything you read here.
• We only provide this information to help you make a better decision.
• While the information provided is believed to be accurate, it may include errors or inaccuracies.
Good Luck,
The CryptoSignalScanner Team

EMA Color Buy/Sell
indicator("EMA Color & Buy/Sell Signals", overlay=true, max_lines_count=500, max_labels_count=500)
EMA
emaShortLen = input.int(9, "Kısa EMA")
emaLongLen = input.int(21, "Uzun EMA")
EMA
emaShort = ta.ema(close, emaShortLen)
emaLong = ta.ema(close, emaLongLen)
EMA renkleri (trend yönüne göre)
emaShortColor = emaShort > emaShort ? color.green : color.red
emaLongColor = emaLong > emaLong ? color.green : color.red
EMA
plot(emaShort, color=emaShortColor, linewidth=3, title="EMA Short")
plot(emaLong, color=emaLongColor, linewidth=3, title="EMA Long")
buySignal = ta.crossover(emaShort, emaLong)
sellSignal = ta.crossunder(emaShort, emaLong)
plotshape(buySignal, title="Buy", location=location.belowbar, color=color.lime, style=shape.triangleup, size=size.large)
plotshape(sellSignal, title="Sell", location=location.abovebar, color=color.red, style=shape.triangledown, size=size.large)
barcolor(close > open ? color.new(color.green, 0) : color.new(color.red, 0))
var line buyLine = na
var line sellLine = na
if buySignal
buyLine := line.new(bar_index, low, bar_index, high, color=color.lime, width=2)
if sellSignal
sellLine := line.new(bar_index, high, bar_index, low, color=color.red, width=2)
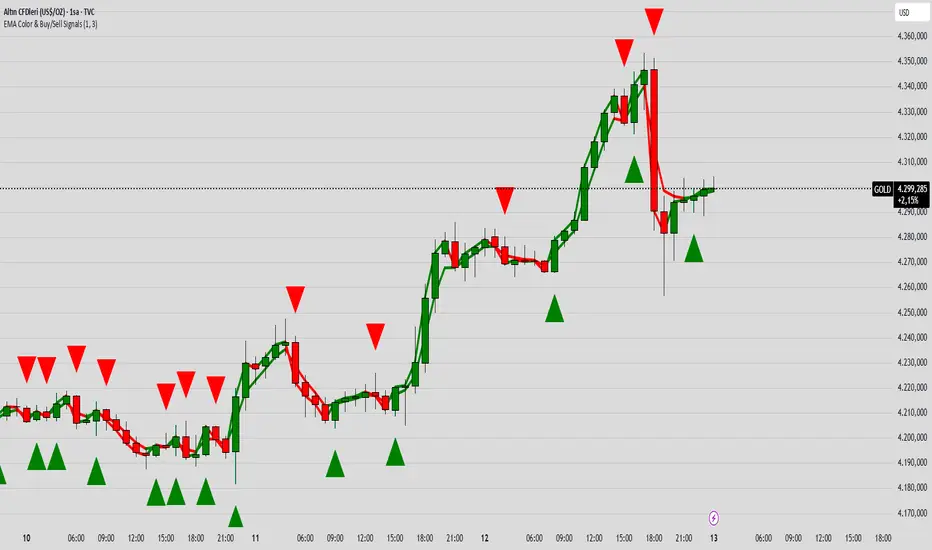
B/S SHIVAJI (v5) ONLY FOR PAPER TRADE
// इस Buy/Sell इंडिकेटर के उपयोगकर्ताओं के लिए एक दोस्ताना संदेश
var bool shownMessage = false
if not shownMessage
label.new(bar_index, high,
text="स्वागत है! इस Buy/Sell इंडिकेटर का उपयोग करने के लिए धन्यवाद। हमें उम्मीद है कि यह आपके ट्रेडिंग सफ़र में आपकी मदद करेगा। नई सलाहों और अपडेट्स के लिए वापस आते रहें!",
style=label.style_none, color=color.blue, textcolor=color.white, size=size.normal)
shownMessage := true
